
With the new release of zap Audit, the process visualization module has been completely overhauled and now has a fresh new look. From now on, findings from our automated data analysis are displayed directly in the process model, so that you as an auditor can evaluate the findings in the context of the process to which they relate. We will show exactly what this looks like in this blog article.
Some background on process mining for auditors and specialist departments
Usually, process mining deals with topics such as throughput times and bottlenecks and therefore focuses mainly on process optimization. In addition to the usual providers of process mining, such as Celonis, my-invenio or DISCO, the Big Four have also recognized the potential of the technology which is now over 10 years old and are implementing projects on an individual basis.
In contrast to this approach, at zap Audit, we developed a standardized and fully automated financial process mining algorithm. This completely reconstructs the business processes from SAP Financial Accounting. Then the predefined indicators also check the reconstructed processes fully automatically.
If the procedure detects any anomalies, outliers, or simply inconsistencies in the data, the corresponding process activity is marked. This is what things still looked like in the last version of zap Audit:
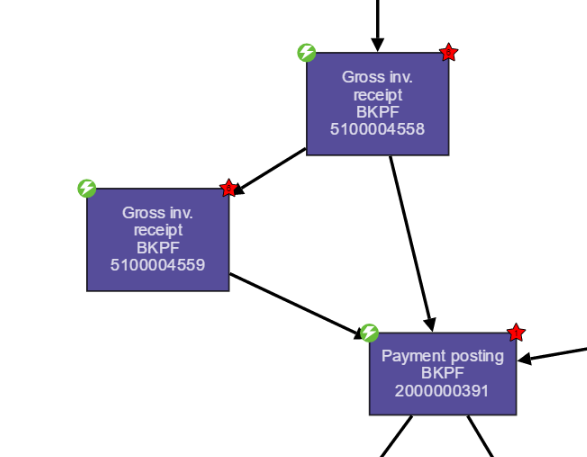
In the upper left and right corners, you can see the marks that represent one of the four predefined audit objectives: Compliance and correctness, opportunities for savings, process standardization and access control. On this basis, however, it was not clear whether and which findings were repeated in the process. For example, “superuser activities ” and “separation of duties conflicts (SoD)” are part of the access control audit objective, but the model did not show which indicator was affected.
Presentation of findings in the process model
In order to make things clearer and to be able to display even more detail, this visualization has now been completely overhauled. From now on, a “water level’-style percentage display shows how many documents for a process step are also affected by the indicator used to navigate to the model. The following example illustrates this: Let’s assume we are looking at the “superuser activities ” indicator already mentioned above and then select the profile of the pseudonymized user “USER_90”; a process step from the process model including a part of the key will then look something like this, for example:
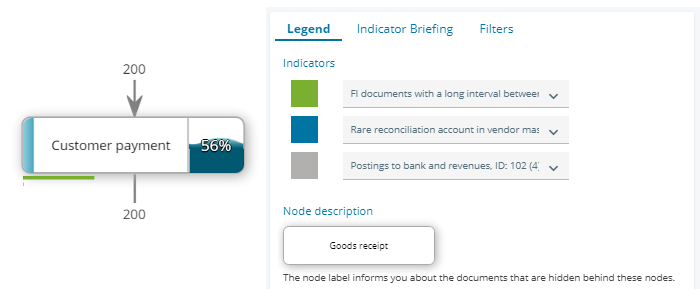
The water-level display (56%) and the colored bars below the process step each refer to indicators. The colored bars below the process step can be individually configured in the legend and only those indicators are available that can also be displayed in the model shown based on a given finding. The labeling of the process step (customer payment) is derived from the document type of a document, while the numbers on the arrows of a process step (200) show how often the variant was processed in the fiscal year under review.
One of the main problems of process mining are often so-called spaghetti models. These have a tendency to be extremely complex, so that such models are generally no longer suitable for analysis. This is exactly where our solution differs from the usual process mining tools. It is always an initial path of the audit action (for example, an indicator and a profile) that forms the basis for the process models. This means that spaghetti models are avoided, the audit procedure remains very much in the foreground and the classification of the processes being dealt with is made clear. This is the only way for auditors, specialist departments, compliance or accounting to remain focused on the essentials. Because, at this point, it is worth saying one more thing: focusing purely on outliers or structural findings (phenomena which occur very frequently) is not necessarily very useful. It is irrelevant whether phenomena occur rarely or very frequently, the critical findings often lie somewhere in between. You could call this new approach: Process Mining 4.0
In the new release, only the most common variant is displayed initially. A variant is a process that looks something like this, for example:
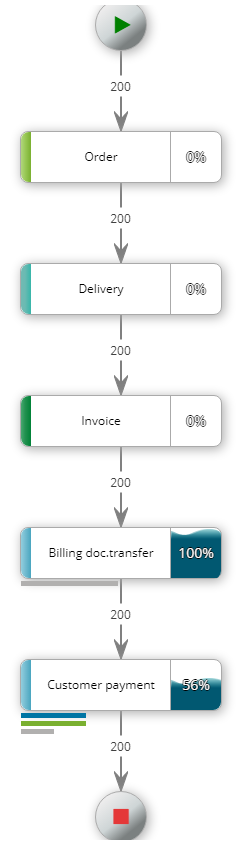
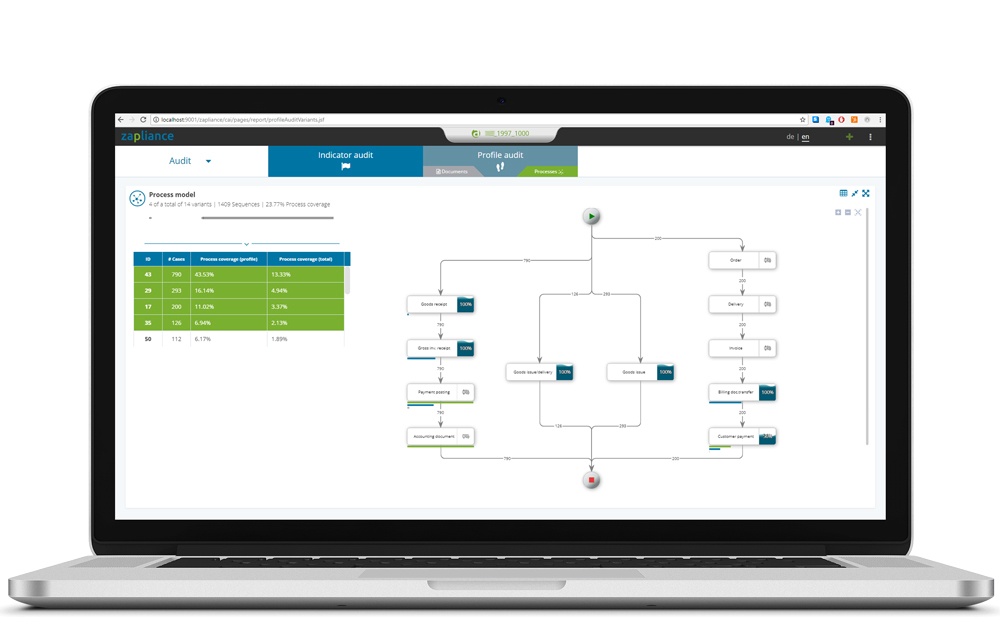
Using a slider above the process model, which is minimized by default, it is then possible to include further variants in the model or to take other variants into consideration:
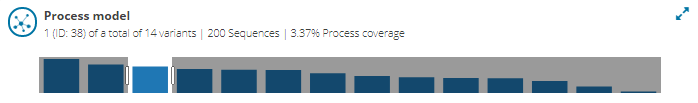
Above the selection (the blue bars), you will find some more, quite interesting information. As we already said in our example above, we are investigating the ” superuser activities ” of “USER_90”. A total of 14 variants of Financial Process Mining were found and reconstructed for this combination of indicator and profile. “200 sequences” tells us the total number of times the process has been run through in the model shown. You can also see the extent of the process coverage is in relation to the complete data set on the far right (3.37%).
As soon as several variants are selected, it quickly becomes apparent that the process models can also become very extensive in this context. By clicking on the two arrows in the upper right corner of the variant selection, the process model view can be enlarged, and the new model is clearly displayed in full screen mode:
And, last but not least
The analysis of company codes for small companies (a max. of 50,000 accounting documents per year) is absolutely free of charge, so that everyone can experience the new process models live and in color. It has to be worth at least taking a look in any case. To do so, simply get in touch with us by clicking on the button below: