
Account movements, cash flow, debit, credit, credit or debit, you name it. Let’s take a look today at exactly what somehow connects them all: Movements on accounts. To do this, we will first take a look at all the accounts, select three interesting examples and take a closer look at them in a time series. That sounds complex and complicated at first, but thanks to the finished SQL statements and a few tricks in Excel it’s not at all.
The necessary basics for accounts in SAP
Let’s start with the necessary tables and fields before we export the files and visualize them in Excel. The following queries can easily be tried out via the transaction “DBACOCKPIT” and then via the navigation “Diagnosis” to the “SQL-Editor”. All queries were also tested on a HANA database.
In order to apply the analysis only to accounts that were actually used in the financial year to be examined, we first use the table BSEG (document segment accounting – FI) and restrict the analysis to the object to be examined (client 800, company code 1000 and financial year 2017) as follows:
SELECT DISTINCT BSEG.HKONT FROM BSEG
WHERE BSEG.MANDT = '800' AND BSEG.BUKRS='1000' AND BSEG.GJAHR=2017
However, the query only provides us with the number of the G/L account for General Ledger Accounting in SAP without the name:
| HKONT |
|---|
| 0000160000 |
| 0000790000 |
| 0000191100 |
| 0000231500 |
| … |
Now you could go with the list to the appropriate department, or you simply read this article further. Unfortunately, the account name is not in the BSEG, because SAP separates the transaction data from the master data. However, a simple join to another table is not enough, as we also need the corresponding chart of accounts. This can be found in table T001 (Company Codes – Customizing), but not in BSEG, so we build the join as follows:
SELECT DISTINCT BSEG.HKONT, T001.KTOPL FROM BSEG
LEFT JOIN T001 ON BSEG.MANDT = T001.MANDT AND BSEG.BUKRS=T001.BUKRS
WHERE BSEG.MANDT='800' AND BSEG.BUKRS='1000' AND BSEG.GJAHR=2017
The result provides us with the corresponding chart of accounts:
| HKONT | KTOPL |
|---|---|
| 0000160000 | INT |
| 0000790000 | INT |
| 0000191100 | INT |
| 0000231500 | INT |
| … | … |
However, we have not made much progress with this in connection with the account name. To do this, we also need the table SKAT (G/L account master (chart of accounts: name)), which we add as follows:
SELECT DISTINCT BSEG.HKONT, T001.KTOPL, SKAT.TXT50 FROM BSEG
LEFT JOIN T001 ON BSEG.MANDT = T001.MANDT AND BSEG.BUKRS=T001.BUKRS
LEFT JOIN SKAT ON SKAT.MANDT = BSEG.MANDT AND BSEG.HKONT = SKAT.SAKNR AND T001.KTOPL = SKAT.KTOPL AND SKAT.SPRAS = 'E'
WHERE BSEG.MANDT='800' AND BSEG.BUKRS='1000' AND BSEG.GJAHR=2017
So far so good. The result can be seen already times:
| HKONT | KTOPL | TXT50 |
|---|---|---|
| 0000160000 | INT | Trade Payables – domestic |
| 0000790000 | INT | Unfinished products |
| 0000191100 | INT | Goods Rcvd/Invoice Rcvd (third party) |
| 0000231500 | INT | Expense from price difference of own goods |
| … | … | … |
However, the list of accounts to be examined must be further restricted, since the sheer number alone is enough to kill you.
Analysis of account movements using 3 examples in SAP
So let’s take a look at three different types of accounts: First, we take an expense account, a bank account and a turnover account and illustrate the individual movements in a graph with Excel. Let’s start with an expense account, such as depreciation. To do this, we only need to adjust the upper query slightly:
SELECT DISTINCT BSEG.HKONT, T001.KTOPL, SKAT.TXT50 FROM BSEG
LEFT JOIN T001 ON BSEG.MANDT = T001.MANDT AND BSEG.BUKRS=T001.BUKRS
LEFT JOIN SKAT ON SKAT.MANDT = BSEG.MANDT AND BSEG.HKONT = SKAT.SAKNR AND T001.KTOPL = SKAT.KTOPL AND
SKAT.SPRAS = 'D'
WHERE BSEG.MANDT='800' AND BSEG.BUKRS='1000' AND BSEG.GJAHR=2017 AND SKAT.TXT50 LIKE '%depreciation%'
The supplement searches the TXT50 field (G/L account long text) of table SKAT for the keyword “depreciation”, where the % means that everything should be included before and after the word. For example, you get “imputed depreciation” as well as “depreciation on fixed assets (unscheduled)” if this type of account name exists. In this case you have to pay attention to upper and lower case, as Hana takes it very seriously in this context. In the IDES test system I only get 3 accounts listed for the query, whereby I also had to adjust the fiscal year:
| HKONT | KTOPL | TXT50 |
|---|---|---|
| 0000211100 | INT | Ordinary depreciation – fixed assets |
| 0000211200 | INT | Extraordinary depreciation – fixed assets |
| 0000481000 | INT | Cost-accounting depreciation |
And now I had to fall back on Prof. Gehrke, because now it’s getting complex. We execute the following query with the G/L account number:
SELECT D.MONAT as MONTH, SUM(CASE WHEN SHKZG='S' THEN DMBTR ELSE 0 END) BALANCE_DEBIT, SUM(CASE WHEN SHKZG='H' THEN DMBTR ELSE 0 END) BALANCE_CREDIT, SUM(CASE WHEN SHKZG='S' THEN DMBTR ELSE 0 END) - SUM(CASE WHEN SHKZG='H' THEN DMBTR ELSE 0 END) TOTAL FROM
(SELECT MONAT, HKONT
FROM BKPF
JOIN BSEG ON (BKPF.MANDT = BSEG.MANDT AND BKPF.BUKRS = BSEG.BUKRS AND BKPF.GJAHR = BSEG.GJAHR AND BKPF.BELNR=BSEG.BELNR)
WHERE HKONT='0000211200' GROUP BY MONAT, BSEG.HKONT) D
JOIN BSEG B ON D.HKONT = B.HKONT
JOIN BKPF BK ON (B.MANDT = BK.MANDT AND B.BUKRS = BK.BUKRS AND B.GJAHR = BK.GJAHR AND B.BELNR = BK.BELNR AND B.HKONT = D.HKONT)
WHERE BK.MONAT<=D.MONAT AND B.MANDT='800' AND B.BUKRS='1000' AND B.GJAHR=2017
GROUP BY D.MONAT
ORDER BY D.MONAT;
What does the query essentially do?
Basically, it goes through all postings to a defined account (highlighted in orange), adds all debit and credit items, and calculates the difference between the two, whereby the values are cumulated for up to one month. The result for the account is scheduled depreciation on fixed assets:
| MONTH | BALANCE_DEBIT | BALANCE_CREDIT | TOTAL |
|---|---|---|---|
| 01 | 112155,97 | 0,00 | 112155,97 |
| 02 | 112155,97 | 0,00 | 112155,97 |
| 03 | 112155,97 | 0,00 | 112155,97 |
| 04 | 112155,97 | 0,00 | 112155,97 |
| 05 | 112155,97 | 0,00 | 112155,97 |
| 06 | 112155,97 | 0,00 | 112155,97 |
| 07 | 112155,97 | 0,00 | 112155,97 |
| 08 | 112155,97 | 0,00 | 112155,97 |
| 09 | 112155,97 | 0,00 | 112155,97 |
| 10 | 112155,97 | 0,00 | 112155,97 |
| 11 | 112155,97 | 0,00 | 112155,97 |
| 12 | 1354655,06 | 0,00 | 1354655,06 |
The account probably corresponds to current practice for the time being, whereby the prompt posting of depreciation for monthly or quarterly financial statements is highly recommended. However, it is not critical in the sense of the annual financial statements.
According to the procedure, I took a closer look at the following two accounts:
- Deutsche Bank (domestic) (0000113100)
- Sales revenues – domestic – finished goods (0000800000)
I have adapted the query with the LIKE ‘%depreciation%’ to LIKE ‘%Bank%’ and LIKE ‘%Sales%’ accordingly, copied the number of the G/L accounts and pasted it into the professor’s query. I then exported the three results to Excel and placed them next to each other as follows:
| Ordinary depreciation | |||
|---|---|---|---|
| MONTH | BALANCE_DEBIT | BALANCE_CREDIT | TOTAL |
| 01 | 112.155,97 | 0,00 | 112.155,97 |
| 02 | 112.155,97 | 0,00 | 112.155,97 |
| 03 | 112.155,97 | 0,00 | 112.155,97 |
| 04 | 112.155,97 | 0,00 | 112.155,97 |
| 05 | 112.155,97 | 0,00 | 112.155,97 |
| 06 | 112.155,97 | 0,00 | 112.155,97 |
| 07 | 112.155,97 | 0,00 | 112.155,97 |
| 08 | 112.155,97 | 0,00 | 112.155,97 |
| 09 | 112.155,97 | 0,00 | 112.155,97 |
| 10 | 112.155,97 | 0,00 | 112.155,97 |
| 11 | 112.155,97 | 0,00 | 112.155,97 |
| 12 | 1.354.655,06 | 0,00 | 1.354.655,06 |
| Deutsche Bank (domestic) | |||
|---|---|---|---|
| MONTH | BALANCE_DEBIT | BALANCE_CREDIT | TOTAL |
| 01 | 0 | 0 | 0 |
| 02 | 0,00 | 1.789,52 | -1.789,52 |
| 03 | 0,00 | 13.211,24 | -13.211,24 |
| 04 | 0,00 | 13.211,24 | -13.211,24 |
| 05 | 0,00 | 13.211,24 | -13.211,24 |
| 06 | 0,00 | 24.510,79 | -24.510,79 |
| 07 | 0,00 | 24.510,79 | -24.510,79 |
| 08 | 0,00 | 58.204,92 | -58.204,92 |
| 09 | 0,00 | 58.210,03 | -58.210,03 |
| 10 | 0,00 | 58.210,03 | -58.210,03 |
| 11 | 18.968,93 | 111.972,37 | -93.003,44 |
| 12 | 5.243.255,27 | 4.364.440,71 | 878.814,56 |
| Sales revenues – domestic – finished goods | |||
|---|---|---|---|
| MONTH | BALANCE_DEBIT | BALANCE_CREDIT | TOTAL |
| 01 | 25.839,67 | 218.339,79 | -192.500,12 |
| 02 | 25.839,67 | 454.773,72 | -428.934,05 |
| 03 | 25.839,67 | 519.837,58 | -493.997,91 |
| 04 | 25.839,67 | 884.841,46 | -859.001,79 |
| 05 | 25.839,67 | 1.022.669,98 | -996.830,31 |
| 06 | 25.839,67 | 1.076.643,02 | -1.050.803,35 |
| 07 | 25.839,67 | 1.113.846,64 | -1.088.006,97 |
| 08 | 25.839,67 | 1.239.086,20 | -1.213.246,53 |
| 09 | 25.839,67 | 1.362.847,61 | -1.337.007,94 |
| 10 | 25.839,67 | 1.507.697,83 | -1.481.858,16 |
| 11 | 25.839,67 | 1.654.096,21 | -1.628.256,54 |
| 12 | 25.839,67 | 1.797.220,47 | -1.771.380,80 |
I then converted the months into plain text so that they were easier to read in the graph and then inserted a line diagram of the months and balances. The result will look like this:
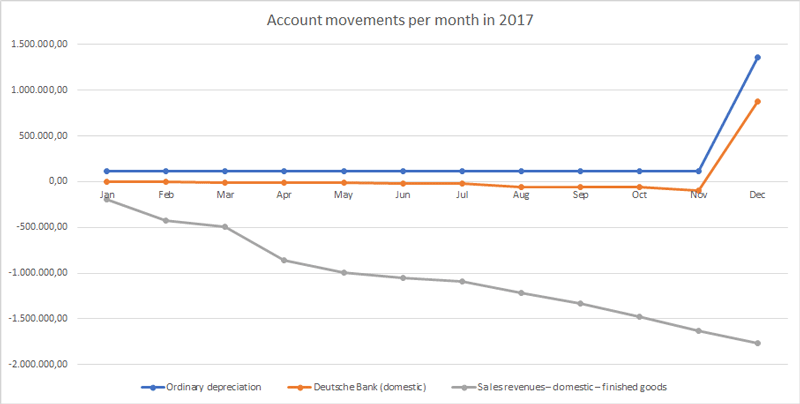
I had already said a few words about the write-offs, so we’ll take a look at Deutsche Bank’s G/L account next. The slightly negative trend until November is noticeable, when over 5 million are suddenly paid in. Of course, I am aware that this is a test system, but such anomalies should definitely be questioned. It would be similar with strong swings in one direction or the other. In this case it would be interesting to investigate how much the deviations deviate from the average in order to be able to speak of a significant deviation.
Revenues, on the other hand, develop exactly as one would probably wish (the negative sign here does not mean falling revenues, but rising ones). The cost of goods is constant at just under €26,000, whereas revenues are rising steadily to just under €1.8 million.